@esna7
I completely misread read that sorry!
I'm enjoying this thread anyway.
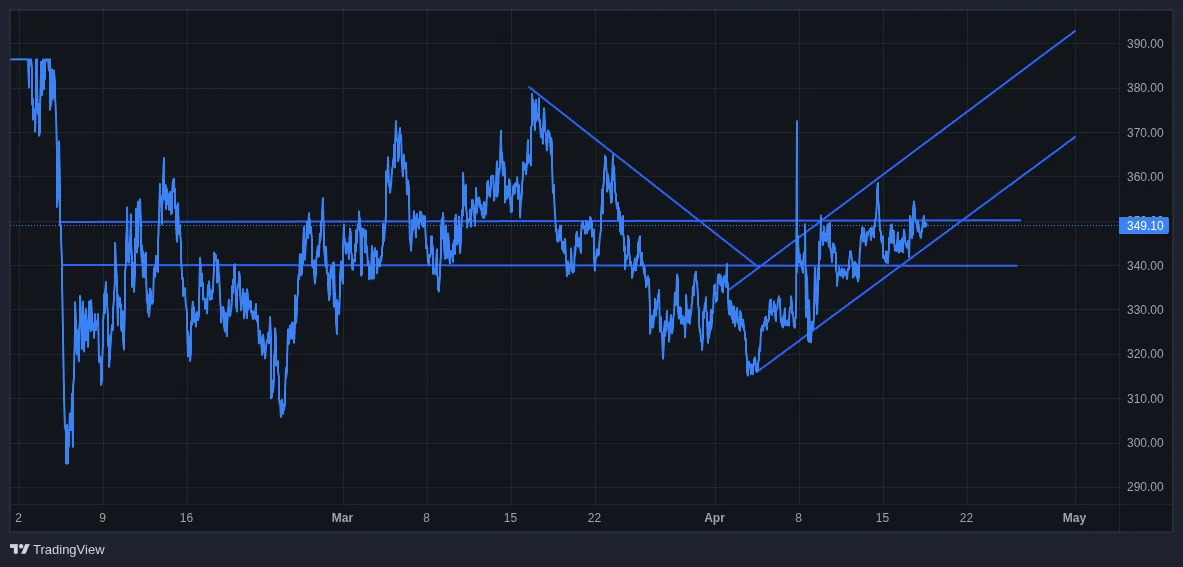
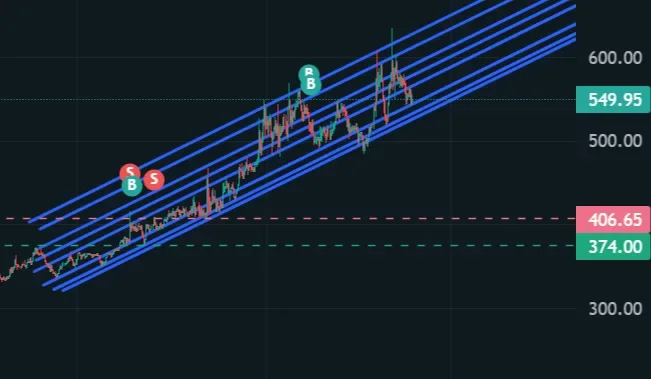
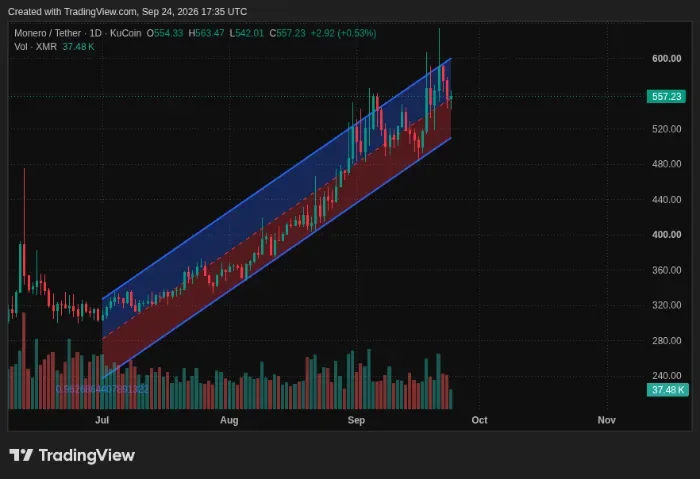
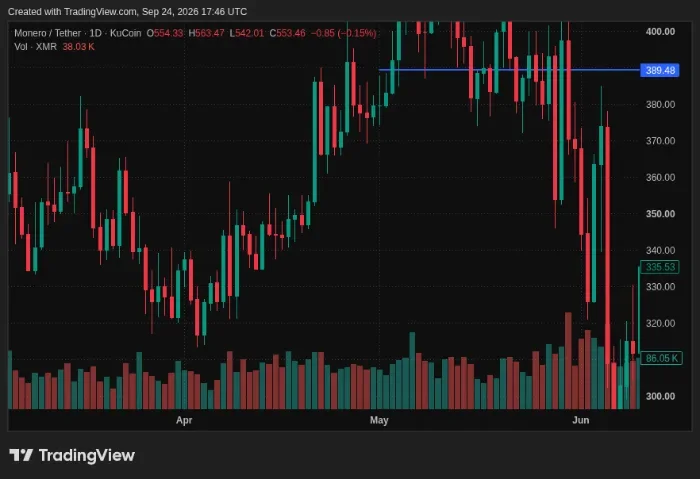
For any trend, support usually sits on a straight line whereas resistance is a lot more random, for some reason. Thats why I just draw parallel lines between the different supports, and the price usually respects those lines. I notice with this recent xmr trend that the old resistance became the new support after the bigger pumps.
I've never actually used regression, apart from for researching statistical arbitrage, which is a very mathematically interesting trading strategy which I never actually put any money into but was fun experimenting with.
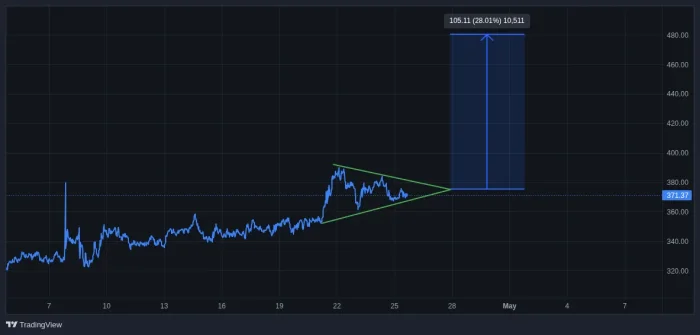
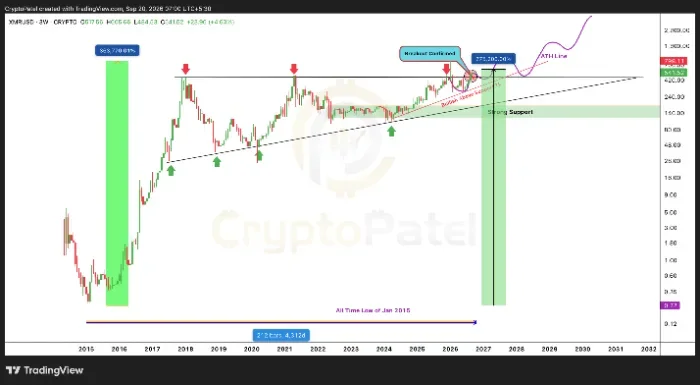
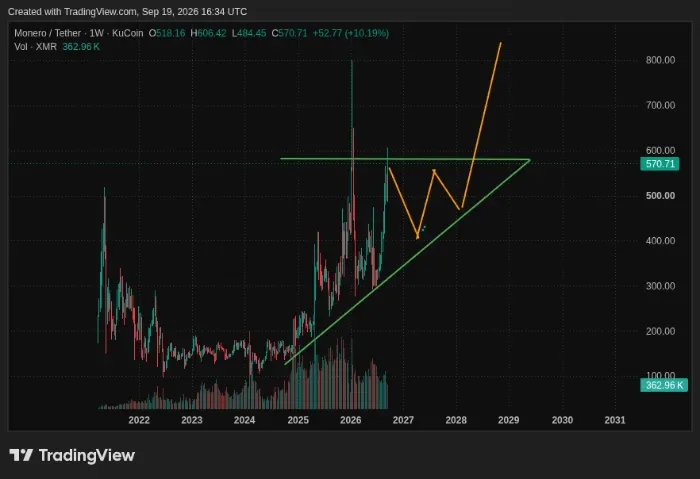
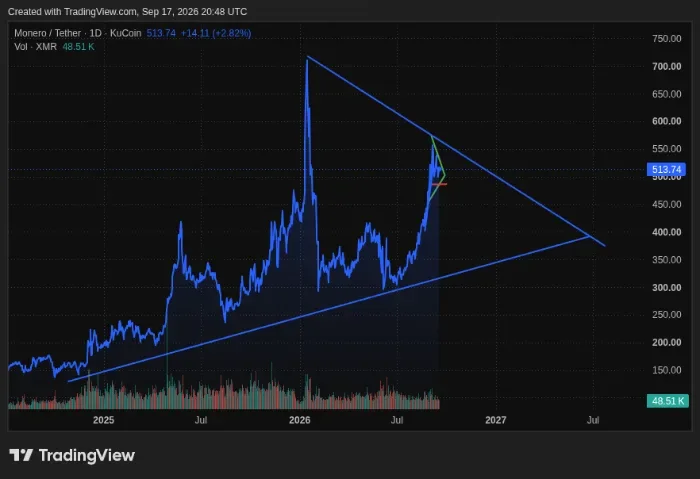
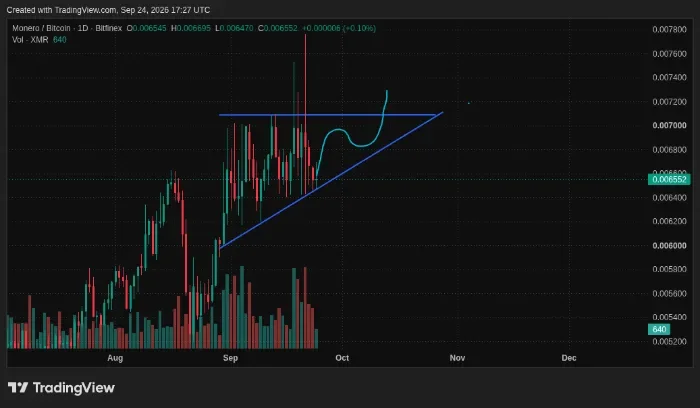
Funny we got very similar lines but you're expecting a breakout and I'm expecting a breakdown. That's the thing about these lines; they can quantify a trend, but they can't tell us how long that trend will last and how it will end. There's an argument to be made on either side but one thing I'm sure we can agree on is to expect more volatility at these prices.