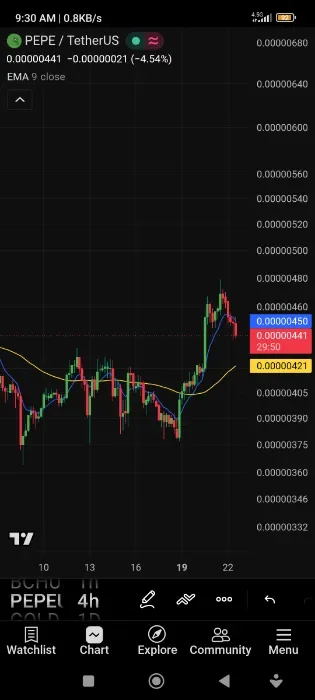
@Nebuchadnezzar_II You wanted an actual trade. Here’s one I posted on October 17, before you asked:
https://read.cash/@yayogerardo/p/181z3831
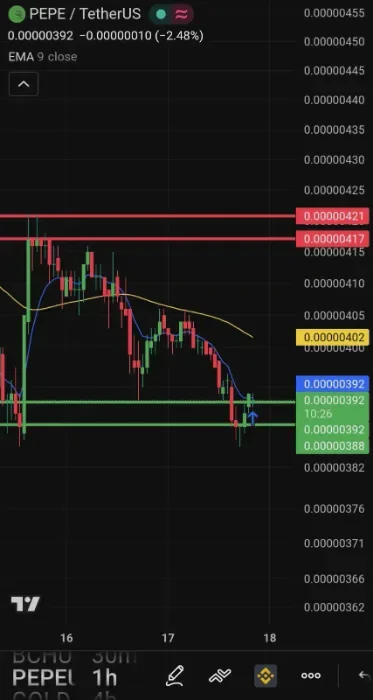
I started on the weekly chart and worked down through the daily, four-hour, and hourly. The weekly was bearish, but the daily recovery was still holding a higher low. I was trading that recovery back toward resistance. I wasn’t expecting a whole weekly trend reversal.
I marked my support and resistance zones first. Price dipped below support, then recovered. I waited for the four-hour hammer to close before buying. Its long lower wick showed the rejection below support.
The hourly Stoch RSI was turning upward too. That supported the entry, but I wouldn’t have bought just because an indicator turned up. I was looking at the price structure and what happened at support.
It was a spot trade. I used the hammer’s low to judge whether the support rejection was still holding. If it failed, I needed to reconsider the trade.
I set a trailing sell to activate just below resistance, with a 2% trail. Until price reached the activation level, the order wouldn’t track anything. After activation, it would follow the highest price reached and trigger on a 2% pullback.
The first bounce didn’t reach activation. When price returned to retest support, I bought a second time while still holding the first entry. I watched closely and was ready to exit if support failed.
Price then rallied through resistance. The trailing sell followed the move and eventually triggered, closing the trade in profit.
So no, I didn’t buy because I saw a green candle. I bought after a four-hour hammer closed at marked support, following a dip below it and a recovery, while the daily higher low still held. I’d already checked the weekly downtrend and planned where I wanted to get out.
The post is dated. You can read what I wrote before the move happened. The second buy came later on the retest. There’s your example.